
Recession Fears Overblown
- Apr 1, 2019
- 7 min read
Updated: Dec 1, 2020

Key Highlights
Markets experienced a global growth slowdown – not a recession.
Market pundits have been warning about a flattening yield curve and a potential recession for most of the 1st quarter.
Had you listened to those pundits, you would have missed out on one of the best quarters since the Great Financial Crisis.
Global growth slowdown likely to trough in the first half.
Maintain a globally diversified, multi-factor, and multi-asset ETF portfolio.
Executive Summary
We suggested in our 4th quarter commentary that volatility would remain high in 2019 unless there was a material improvement in trade negotiations, the U.S. Federal Reserve became more accommodative, or global economic data improved. Two of these three risk factors materially improved in the 1st quarter which resulted in a strong rally in equities globally.
Furthermore, we wrote that the U.S. Federal Reserve needed to be more accommodative with not only their interest rate policy but also with their balance sheet unwind in order to ensure stability in the financial system. Essentially, this is what the Federal Reserve announced at its March FOMC meeting.
The S&P 500 Index increased by 13.65% in the 1st quarter which was its best quarterly return since 2009. From December 24, 2018 through March 29, 2019, the S&P 500 Index is up a remarkable 21.22%.
U.S. Federal Reserve
The U.S. Federal Reserve Chairman, Jerome Powell, kept the federal funds target range unchanged at 2.25-2.50% at the March FOMC meeting. Moreover, the Federal Reserve indicated no plans for interest rate hikes in 2019 and provided a more accommodative policy path over the next couple of years. The Federal Reserve plans to wind down its balance sheet normalization beginning in May 2019, with the program concluding at the end of September 2019.
The Federal Reserve now expects a slightly higher unemployment rate in the coming years. The unemployment rate is now projected to be 3.7% at year-end, up from 3.5% previously. The unemployment rate is projected to increase in 2020 and 2021.
Yield Curve
The inversion of the U.S. yield curve is a topic that the financial media has discussed quite a bit lately. Specifically, the 3-month Treasury bill vs. 10-year Treasury bond yield curve turned negative for the first time since 2006 (see chart below).
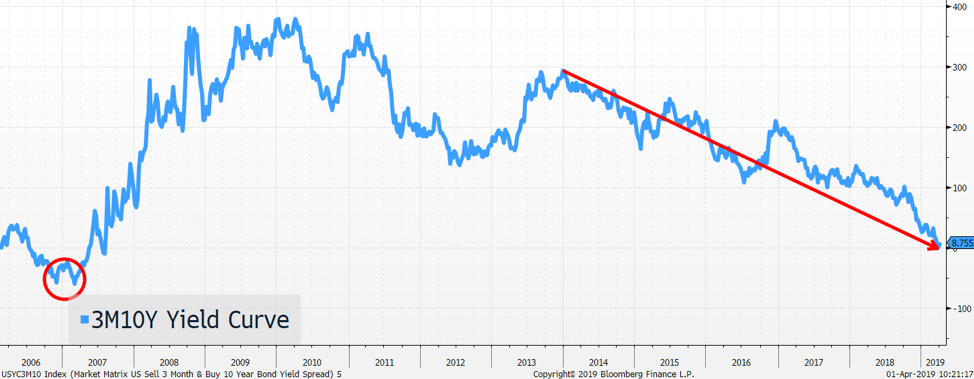
Source: Bloomberg, Astoria Portfolio Advisors
However, not all parts of the U.S. interest rate yield curve have inverted. For instance, the 2s10s spread remains positive at 14bps as of March 29, 2019 (see chart below). In fact, the 2s10s spread has historically been more regarded for recession concerns.

Source: Bloomberg, Astoria Portfolio Advisors
According to J.P. Morgan Research, 7 out of the 8 U.S. yield curve inversions since 1960 were followed by a recession. However, contrary to the negative concerns of an inversion by the financial media, equites historically have produced strong returns in the quarters following an inversion. Moreover, according to J.P. Morgan Research, the number of months between the 2s10s inversion and the subsequent recession has increased (17 months) for the prior 3 inversions compared to the prior four instances (9 months). Moreover, J.P. Morgan’s Research group notes that there was a 22-month lag between the time the yield curve inverted in 2008 and the subsequent recession. The bottom line from Astoria Portfolio Advisors is that portfolios should certainly be rebalanced to prepare for a late cycle environment, but investors shouldn’t panic over recession fears just yet.
The NY Federal Reserve Bank maintains a Recession Probability Index for the next 12 months ahead. Currently, the NY Federal Reserve’s Recession Probability Index for 2020 stands at 24% (see chart below).

Source: Bloomberg, NY Federal Reserve Bank, Astoria Portfolio Advisors
Tariffs
Trade discussions between the United States and China continue to progress in a positive direction. We have argued that if there was a trade resolution, International Developed and Emerging Market equities would stand to benefit the most. Year to date, International equities have posted strong returns which we will discuss below.
Economic Data, Valuations, and Portfolio Construction
Global economic data deteriorated in 2018 and remains weak in 2019. The J.P. Morgan Global Manufacturing Purchase Managers Index, which is a measure of economic health for the manufacturing and service sector, has steadily declined since early 2018 (see chart below). A slowdown in the Chinese and European economies along with trade concerns have been among the key drivers behind the global growth weakness.

Source: Bloomberg, JP Morgan, Astoria Portfolio Advisors
The United States economy isn’t immune to the global growth slowdown. The Atlanta Fed GDPNow Forecast Model is 1.71% as of March 29, 2019. It is worth noting that the model reached a 2-year low of 0.17% on March 12, 2019. We believe the weakness in global economic data will trough in the 1st half of 2019. In fact, the stock market’s significant rally in 2019 could very well reflect our view.

Source: Bloomberg, Atlanta Federal Reserve Bank, Astoria Portfolio Advisors
According to FactSet, the S&P 500 Index forward P/E ratio is 16.3x as of March 29, 2019 and is slightly below the 5-year average (16.4x) but above the 10-year average (14.7x). Our preference is for U.S. stocks with above average growth, strong balance sheets, and low financial leverage.
Despite investors being 'all in' on defensives to start 2019, several cyclical sectors have outperformed the S&P 500 Index in the 1st quarter. Technology (+19.4%), Industrials (+16.6%), Energy (+15.4%), and Consumer Discretionary (+15.3%) have all outperformed the S&P 500 by a healthy margin in the 1st quarter.

Source: Bloomberg
Our strategic models went overweight equities in mid-January (after being underweight in 2018) as we felt a more accommodative Federal Reserve would bode well for stocks. Plus, we thought U.S. valuations were very attractive after the massive decline in the 4th quarter. Our ETF portfolios are now overweight U.S., underweight Europe, underweight Japan, and overweight Emerging Market equities relative to our benchmarks.
International Equities
On the back of the Federal Reserve’s more accommodative stance, International Developed and Emerging Markets equities posted strong returns in the 1st quarter. The Shanghai Stock Exchange Composite Index (China) increased by 23.94% (in CNY terms), the Euro STOXX 50 Index (Europe) rose by 12.85% (in Euro terms), the MSCI Emerging Markets Index was up 10.26% (in USD terms), and the Nikkei 225 Index (Japan) increased by 6.81% (in Japanese Yen terms). The Bloomberg Dollar Spot Index (BBDXY) increased by 0.21% in the 1st quarter.
In our view, International equities remain attractive as they are trading at a sizable valuation discount compared to the U.S. stock market. According to ETFAction.com, the iShares MSCI ACWI ex U.S. ETF (ACWX) currently has a P/E ratio of 13.07 based on 2019 analyst estimates. This is significantly lower than the SPDR S&P 500 ETF (SPY) which has a P/E ratio of 16.74x based on 2019 analyst estimates.
Fixed Income
U.S. interest rates declined across various maturities in the 1st quarter. Yields on 2-year, 10-year, and 30-year U.S. Treasury Bonds were 2.26%, 2.40%, and 2.81% respectively as of March 29, 2019. Given that the U.S. yield curve is relatively flat, we believe ultra-short duration bond funds are providing investors with a more attractive opportunity compared to longer duration bonds.
We were cautious on the fixed income marketplace in 2018 as we thought yields and inflation would rise. This was the right call for the majority of 2018 as the Bloomberg Barclays U.S. Aggregate Bond Index was down 2.65% from January 1, 2018 through November 2, 2018. However, as the stock market began its decline in the 4th quarter, bonds staged an impressive rally in the final 7 weeks. For the calendar year of 2018, the Bloomberg Barclays U.S. Aggregate Bond Index was up 0.01%.
The Bloomberg Barclays U.S. Aggregate Bond Index is up 2.94% as of the end of the 1st quarter. We are now less pessimistic on U.S. fixed income bonds in 2019. However, we continue to prefer owning higher quality U.S. bonds across our portfolios. We maintain an overweight position in U.S. municipal bonds and U.S. mortgage-backed securities, both of which are highly rated. In fact, over 70% of our fixed income bonds are rated AAA or AA. Our largest underweight is in U.S. Treasury securities.
Commodities
Along with stocks and bonds, commodities rebounded in the 1st quarter. The Bloomberg Commodity Index increased by 5.70% although, once again, there were notable divergences across the complex. The United States Oil ETF (USO) increased by 29.40%, Invesco DB Base Metals ETF (DBB) increased by 10.72%, the SPDR Gold ETF (GLD) rose 0.63%, and the Invesco DB Agriculture ETF (DBA) declined by 2.77%.

Source: Bloomberg
We do not think rising inflation is a major risk for the economy. We are closely monitoring the New York Federal Reserve Underlying Inflation Gauge Index which has steadily declined since June 2018 (see chart below).

Source: Federal Reserve Bank of NY, Bloomberg, Astoria Portfolio Advisors
Alternatives and Market Timing
In 2018, our view was that liquidity would decline due to higher U.S. interest rates and the U.S. Federal Reserve implementing their Quantitative Tightening program. We repeatedly wrote that a continuation of trade protectionism polices could further increase the probability of a full-blown trade war, leading to a decline in stocks. For these reasons, we included alternatives across all our ETF portfolios in 2018.
However, higher interest rates and a full-blown trade war are less of a risk factor at this juncture, so we have reduced some of our alternatives exposure in our strategic ETF portfolios. We are primarily utilizing bonds (and cash) to dampen our portfolio volatility during stressed markets in our strategic portfolios. However, our Multi Asset Risk Strategy (MARS) ETF Portfolio still maintains a healthy allocation towards alternatives.
Our view has been that timing the market top and bottom is extremely difficult and that investors are incentivized to stay fully invested in strategic asset allocation portfolios. The last two quarters proved our point. The S&P 500 Index declined 13.52% in the 4th quarter and rallied 13.65% in the 1st quarter of 2019. We continue to advocate not only to stay fully invested but to maintain a globally diversified, multi-factor, and multi-asset ETF portfolio.
In our next report, we will discuss the breakdown of each of our ETF Portfolios in more detail.
Best, John Davi
Founder & CIO of Astoria
For full disclosure, please refer to our website:
Comments