
Do you know the Earnings Growth Estimate for your ETF?
- John Davi

- Feb 2, 2021
- 2 min read

Before we get into Astoria’s ETF Valuation Matrix, we wanted to alert you that we have updated our Portfolio Construction Dashboard which is stored here (click here; if you don’t have access please let us know and we will sign you up). All of our models, fact sheets, and in-depth tools are stored on this dashboard. As a background, our Portfolio Construction Dashboard was originally created for Astoria’s Investment Committee to track and understand our portfolio risk and return. We are now making it available to our clients.
Aside from understanding our portfolio risk and return, we also provide the following:
Aggregate Portfolio Valuation Data: Many investors will know what the PE is for a single ETF, but do they know what the aggregate PE is for their entire portfolio? We report our portfolios’ PE, ROE, ROA, and other valuation data.
ETF Portfolio Tilt Tables: One of the biggest mistakes we see investors make when putting together a portfolio is the “throw spaghetti against the wall approach.” Typically, there are too many ETFs in a portfolio which leads to unintended portfolio risks.
ETF Portfolio Attribution: Now that you have a portfolio, do you know what is driving the performance and risk? How are all the pieces of the puzzle fitting together?
Astoria believes we could be one of the only firms that are delivering this level of analysis to investors.
As we are ultimately quantitative in nature and adamant in being transparent, we wanted to highlight some key fundamental metrics which were crucial in how we chose the ETFs across our suite of solutions. The source for all the data below is ETFAction.com and was retrieved on January 22, 2021.
Key Ratios of Equity ETFs: Sorted by ROE

Earnings Growth Estimates of Equity ETFs: Sorted by 2021E EPS

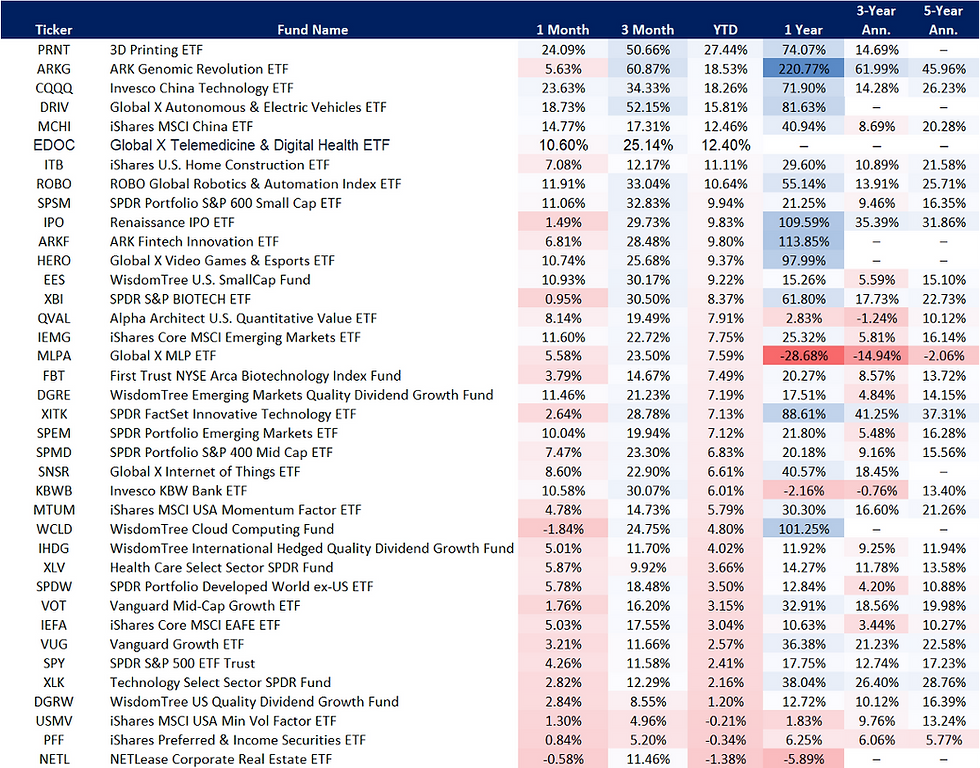
Performance of Equity ETFs: Sorted by YTD
Key Ratios of Physical Commodity, Commodity Equity, Metals & Mining, Clean/Renewable Energy, and Cyclical ETFs: Sorted by ROE

Earnings Growth Estimates of Physical Commodity, Commodity Equity, Metals & Mining, Clean/Renewable Energy, and Cyclical ETFs: Sorted by 2021E EPS

Performance of Physical Commodity, Commodity Equity, Metals & Mining, Clean/Renewable Energy, and Cyclical ETFs: Sorted by YTD

Fundamentals of Fixed Income ETFs: Sorted by Effective Duration

Issue Types of Fixed Income ETFs: Sorted by Exposure to Sovereign Bonds

Best,
Nick Cerbone
Astoria Portfolio Advisors Disclosure: As of the time of this writing, Astoria held positions on behalf of client accounts in the ETFs mentioned in this report. Note that this is not an exhaustive list of our holdings. Our holdings will vary depending on risk tolerances, tracking error bands, and client mandates. There are no warranties implied. Astoria Portfolio Advisors LLC is a registered investment adviser located in New York. Astoria Portfolio Advisors LLC may only transact business in those states in which it is registered or qualifies for an exemption or exclusion from registration requirements.
For full disclosure, please refer to our website.
Comments